
Most Xero users log in to raise invoices, enter bills and reconcile the bank. Far fewer open Analytics, even though it sits inside the same subscription and answers questions that people usually take to Excel.
This article explains what Xero Analytics is, how it helps small business owners, accountants and finance teams. It also covers which Singapore plan includes which features and how to start using it.
What is Xero Analytics?
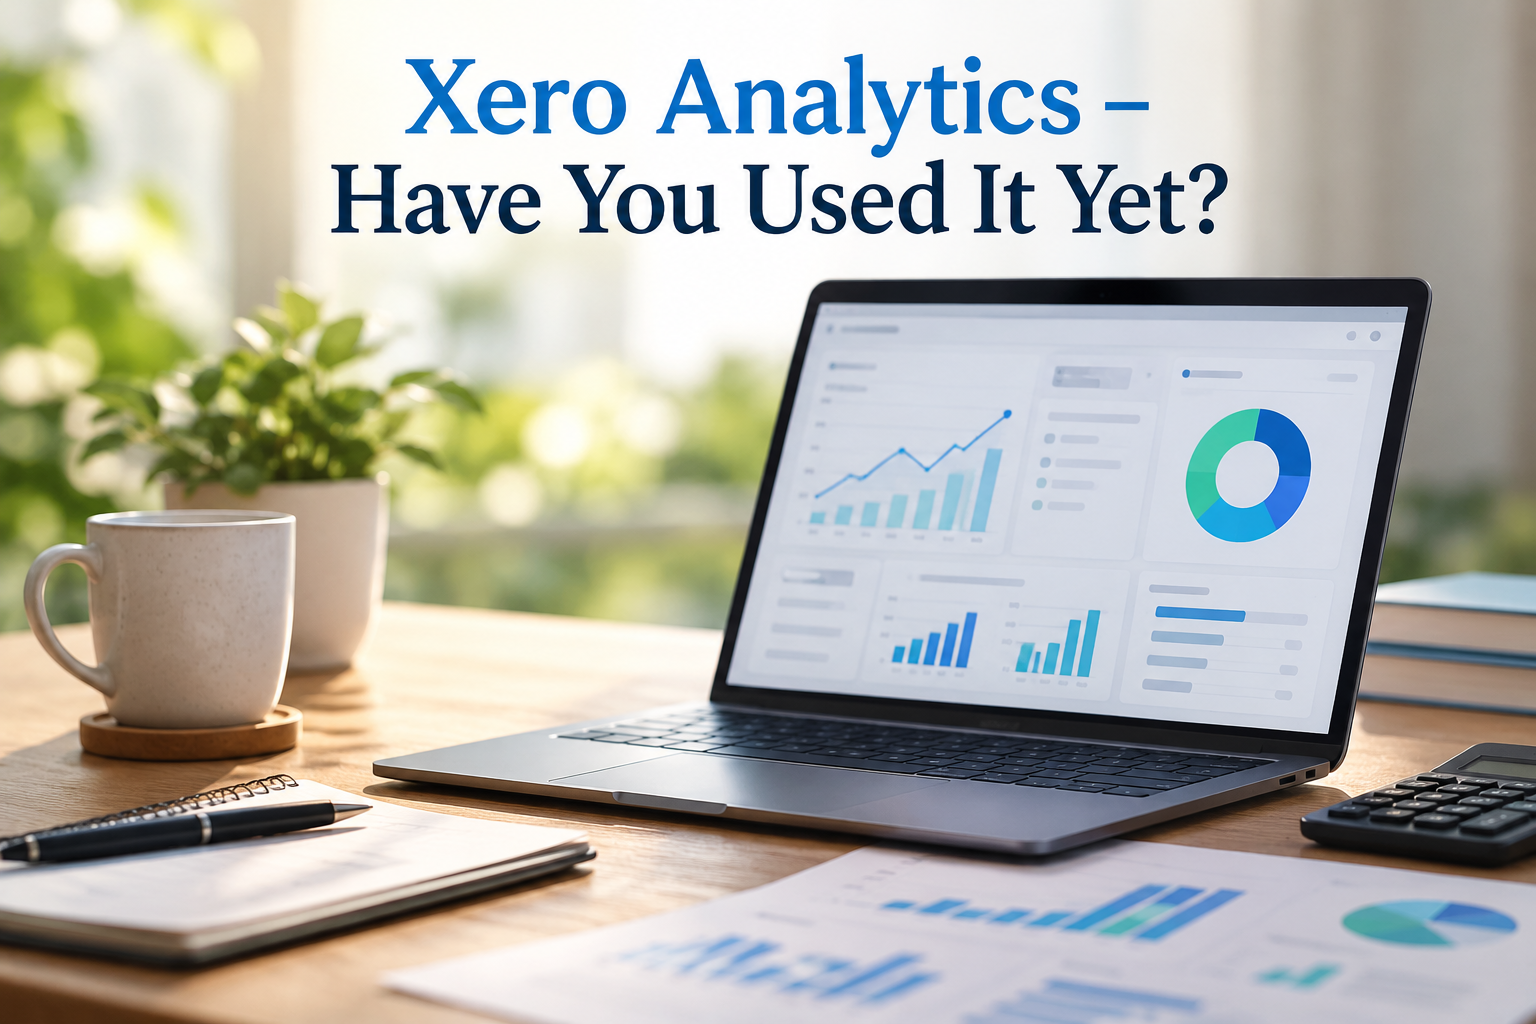
Xero Analytics is a set of built-in tools that turn the data already in your Xero file into graphs, dashboards, financial health scorecards and cash flow forecasts. You do not export anything or build a spreadsheet. The tools read your live Xero data.
Xero bought the reporting company Syft Analytics in September 2024 and has been adding Syft’s features to Xero as Analytics powered by Syft.
Have you used it yet? A quick self-check
If you can answer yes to all four questions without opening a spreadsheet, you probably do not need this article.
- Do you know roughly what your bank balance will be in four weeks?
- Do you know which months were your most and least profitable this year?
- Do you know how much your customers owe you and how late they pay?
- Can your accountant show you a one-page view of how the business is doing?
Xero Analytics can answer all four from data you already have.
How does Xero Analytics help small business owners?
See a cash shortfall before it arrives
The cash flow forecast uses the invoices and bills in Xero to show your expected bank position over the coming weeks. The cash flow manager also learns from past payment patterns to predict recurring transactions.
This is the feature most owners find useful first. A shortfall that shows up three weeks ahead gives you time to chase invoices, negotiate a supplier’s payment date or arrange financing. A shortfall discovered on payday leaves you with fewer options.
Check whether the business is really making money
Performance graphs show revenue, expenses and profit trends without any set-up. On Standard and Premium plans, you can customise a dashboard so the numbers you care about, such as gross profit, overheads and debtors, sit on one screen.
Keep a 30-minute monthly check-up
Most owners do not need more reports. They need to look at the same few numbers on the same day every month. A saved dashboard makes that routine quick enough to keep up.
How does Xero Analytics help accountants and finance teams?
Spend less time building the same report
Many accountants rebuild a similar management pack for each client every month. A configured dashboard presents the same measures from live data, which frees time for explaining the numbers instead of preparing them. How much time you save depends on how standardised your reporting already is.
Move the month-end meeting from reporting to advice
Premium plan adds KPIs and ratios and lets you benchmark yourself against your industry. Standard and Premium plans include financial health scorecards. These give you a structured starting point for a conversation about margins, debtor days or cash cover, rather than a walk through the trial balance.
Use analytics as an early data-quality check
Forecasts and graphs only reflect what is in the file. A cash forecast that looks too good often means supplier bills are sitting unentered, and a profit graph that dips suddenly can point to a miscoded transaction or missing accrual. Reviewing the graphs before the monthly close can surface these issues sooner.
Who can see Analytics in a Xero file?
Users with Standard plus reporting access or Advisor permissions, can open Analytics on eligible plans. If a staff cannot see it, check their user role first.
Which Xero plan includes which analytics features in Singapore?
Analytics features scale with the plan. Check with us for any promo pricing or if you need help on deciding which plan is more suitable for your business.
| Feature | Starter | Standard | Premium |
|---|---|---|---|
| Cash flow forecast | 30 days | 60 days | 180 days |
| Performance graphs | Yes | Yes | Yes |
| Customisable dashboards | No | Yes | Yes |
| Financial health scorecards | No | Yes | Yes |
| KPIs and ratios | No | No | Yes |
| Industry benchmarking | No | No | Yes |
Starter is limited to 20 invoices and 5 bills, so its graphs will show little for a business with regular activity. For most growing SMEs, Standard is where analytics starts to become useful.
How do you start using Xero Analytics?
- Check your plan and your user role. Features you cannot see may belong to a higher plan or need different permissions.
- Tidy the data. Reconcile bank accounts, enter outstanding supplier bills, approve draft invoices and fix any miscoded transactions.
- Open the cash flow forecast. Compare it with what you already expect over the next month. If they disagree, find out why.
- Build one dashboard. Choose five or six measures you will review monthly, such as revenue, gross profit, overheads, debtors and cash.
- Set a review date. Put a monthly slot in the diary, ideally after the books are up to date, and invite your accountant or finance lead.
Common mistakes when using Xero Analytics
- Trusting numbers from an untidy file. Unreconciled accounts and unentered bills make every graph and forecast less reliable.
- Putting too much on the dashboard. Twenty measures on a screen means none of them gets read.
- Forgetting what falls outside the forecast window. On Starter plan, a payment 45 days away is invisible. Plan large known payments, such as GST to IRAS or annual bonuses, separately.
- Looking once and never again. Analytics earns its value through a regular routine, not a one-off look.
- Treating the forecast as a guarantee. Projections are for information only and may not capture every factor.
How can training help you get more from Xero Analytics?
Analytics only helps if the file behind it is tidy and someone reads the numbers each month. That is where most teams get stuck, and it is where our training helps.
- Owners and managers: learn to read the cash flow forecast and dashboards, and what to do when the numbers change.
- Finance teams and accountants: learn to set up dashboards, use scorecards in client or management meetings, and spot data problems before month end.
- Your own file: we work with your actual Xero data, so you leave with a dashboard and a monthly review routine that suit your business.
361 Degree Consultancy (361DC) trains Singapore SMEs on the Xero software they buy from us and advises on business operations, so the training connects to how you run the business, not only to which buttons to click.
Ready to put Xero Analytics to work?
Call us on 6515 7906 or email enquiry@361dc.com to arrange a session. We can start with a review of your Xero file and show you what Analytics can do for your business.
Frequently asked questions about Xero Analytics
It is a set of built-in Xero tools that show your data as graphs, dashboards, scorecards and cash flow forecasts. What you get depends on your plan.
Yes for the features in the table above. If you need more features, speak to us about your requirements.
Starter shows 30 days, Standard 60 days and Premium 180 days.
No. Owners get the most immediate value from the cash flow forecast and dashboards, while accountants use scorecards, KPIs and benchmarks to support advisory work.
Analytics powered by Syft is built into Xero. Syft Analytics is a separate app on the Xero App Store with a broader feature set, including consolidations, valuations and more advanced forecasting.
The usual cause is the data. Check that bank accounts are reconciled, supplier bills are entered and invoices are approved with the right due dates.
No. It shows what is happening in your numbers. Your accountant helps you decide what to do, including tax and compliance matters.